Artifacts of Recent History
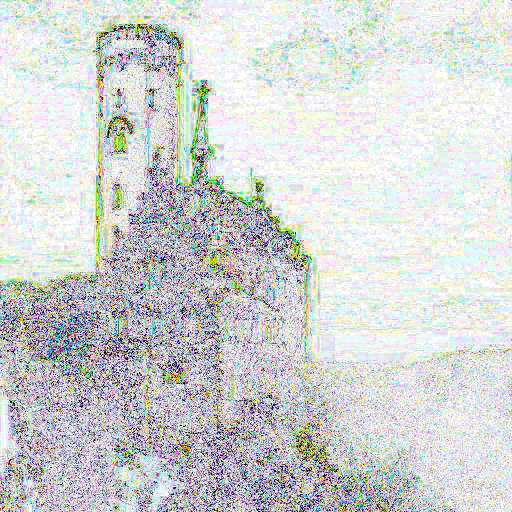
Check out this amazing image. I’ve provided it at three viewing styles below:
I present to you the beautiful Miss Mona Lisa, compressed and ready to stream or download. See my pixels? Barely.

How about now? I’ve increased the volume and the imaging but it’s the same source. I’ve boosted and compressed some and don’t you like that ‘dither’ between the colors? No difference from the original, right? Do you have superman eyes or something?

Now we’re really booming, nice and loud. What a beautiful Mona Lisa, no? If you believe this is the Mona Lisa you are nutty. This is a visual representation of compressed digital audio files. You’ve lost so much already. CD audio (16-bit, 44KHz, CD/WAV) is closer to this image than you’ve been led to believe, and MP3 files are literally pixelated audio.
See, degraded files stay degraded no matter how large you make them. Only the original studio masters hold the highest quality audio. CD quality, DVD quality, digital quality are all marketing terms to describe what you see above.

Hopefully soon, technology will bring something akin to this to our ears
(or at least allow us to hear the detail and decide for ourselves)
There’s all sorts of people around the internet trying to tell you that you can’t see, nor will you miss, the lines in her face. Not only do they claim you are imagining this, they think it’s ridiculous that you should be able to pay for higher resolution audio at all.
These people are the true snake-oil salesman, putting bad technology on top of bad technology.
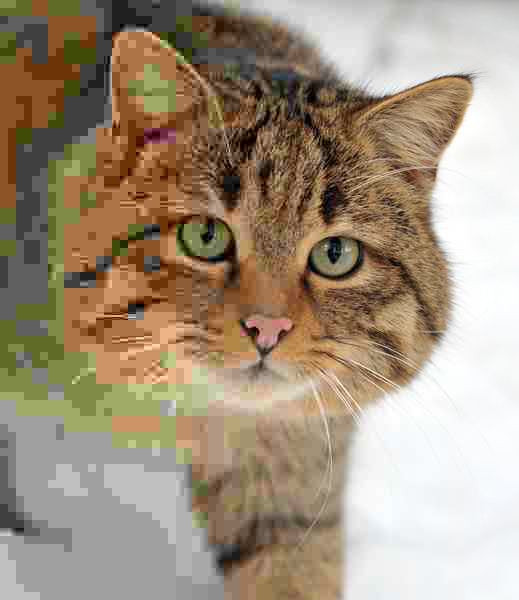
Here’s a few more images to get you thinking about digital sampling in regards to your hearing ability:


Do visual and audible sciences correlate? Not exactly. Many digital sampling and compressions methods do correlate across video and audio. These examples in the visual realm should prove to be good examples of the challenges of digital signal sampling, and the folly at assuming that digital actually recreates an analog signal truthfully – especially after lossy compression is applied.

Everyone understands and believes something they can see or read themselves, but many will believe a person on TV or the internet spouting statistics about what they can and can’t hear. Don’t believe them, believe your own analog ears and your own analog eyes!

Have you ever had a car radio with a dial that won’t go to the exact volume you want? The ‘chunks’ are too big to get it exactly where you want it? That’s a lack of resolution in the volume knob. It can’t go (resolve) to the volume you want so it goes to something nearby as picked by the machine. Put that lack of resolution throughout every part of the audio program and the overall effect is perhaps not easily heard, but it seems to be easily felt.
Another, mathematical way to think of this — for digital audio to exist at all the computer needs to recreate the sound waves as numbers. To do this it plots the signal on a graph, using XY coordinates. The range of the Y axis is basically “bit depth” and the range of the X axis is “sampling rate”.
To put real numbers on it, 16/44 (redbook CD) allows for a grid of 44,100 x 65,000 to plot a second of audio. The 24/96 “HD” standard enlarges that grid to 96,000 x 16,000,000. The highest resolution that anyone is currently working with in audio (and that most DAP’s can plays natively) is 24/192 and has a grid of 192,000 x 16,000,000. These recordings are rare but really sound amazing on a good playback device.
Here’s an image explaining resolution increase. Watch the grid size.
We are talking all the detail of vinyl with none of the noise, rumble, hum, or dust. It’s the best of both worlds (finally) – digital convenience with true sound.
Here’s a good video explaining the lay of the land. His video is filled with facts about how this bit rate and sampling rate translate into X,Y on the graph.
Here’s a better video explaining this all in detail.
SAVE THE AUDIO Contents:
1- Artifacts of Recent History
2- Hearing Science Has Not Decoded Musical Enjoyment
3- Analog & Digital, Sitting In A Tree
5- Testimonials and More Information on Digital Audio
6- Team Ear [coming soon]


